Floodplain Risk Assessment
What are risk assessments?
Townsville City Council has undertaken flood studies to better understand how flood hazards impact our city’s landscape. Now that we have that better understanding, it is important to know the level of risk that these hazards pose to people and property.
Why have we done a risk assessment?
When new developments are being proposed in our city, they need to meet certain standards in the Townsville City Plan to ensure they are resilient to natural events, like flood. Currently, our Townsville City Plan has mapped areas for hazards to help us plan development.
By doing a risk assessment, we can better understand the risk that is posed by a hazard to people, property and the environment. Moving to this risk-based approach will help us to make better planning decisions. It is also a Queensland Government requirement for incorporating new flood information into the Townsville City Plan.
What is the difference between Hazard and Risk?
When we talk about a hazard, we are talking about a natural event that has the potential to cause harm to people, property or the environment. For flood, deeper or fast flowing flood waters present a high hazard, whereas shallower and slower moving waters present a low hazard.
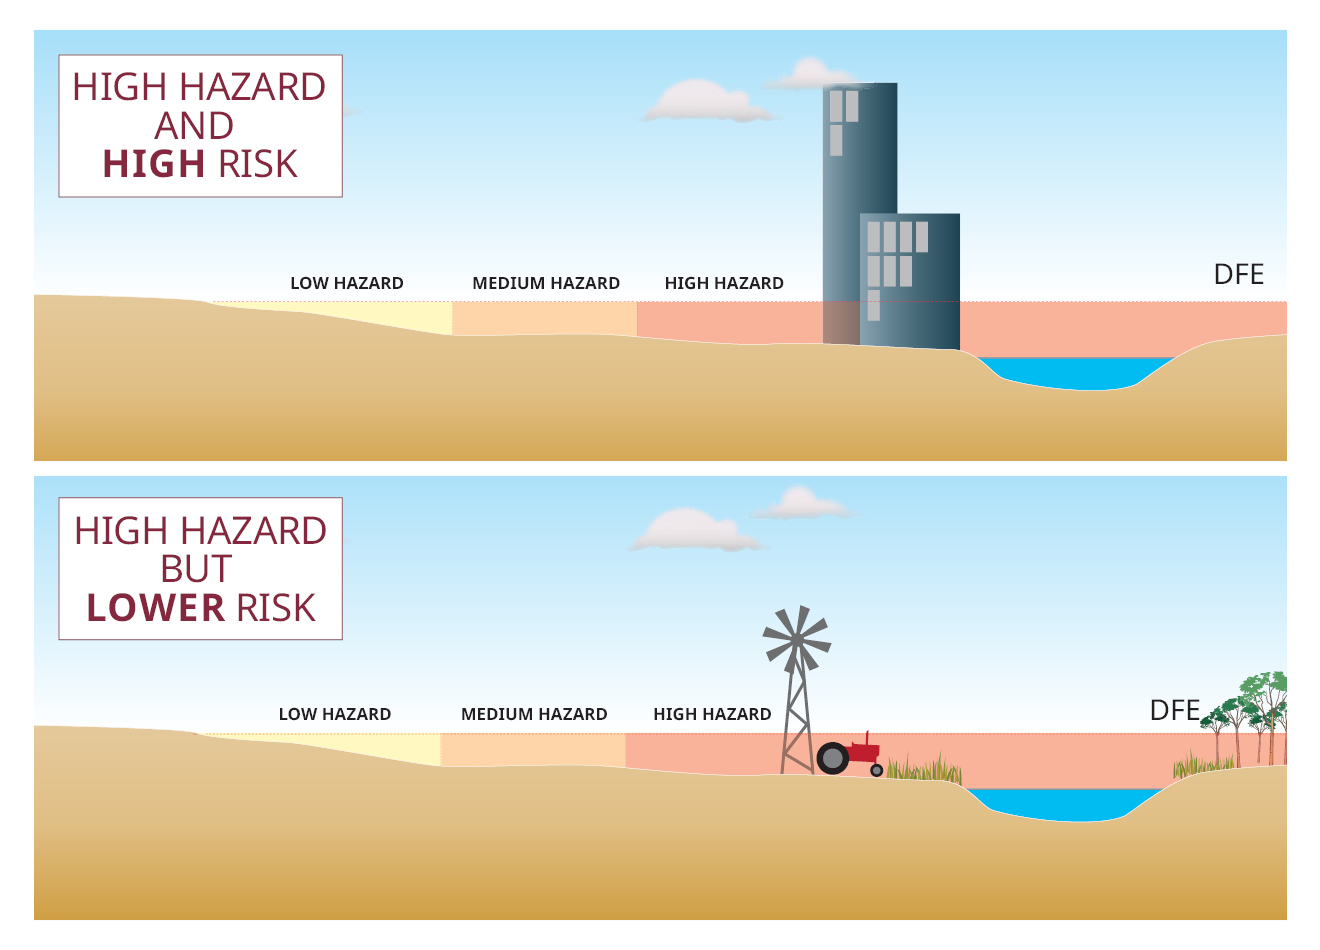
Risk is how likely it is that a hazard will impact people, property or the environment, as well as the consequence of that impact. For example, an area close to a river which floods regularly might be a high hazard area, but if there are no buildings located here, there are limited consequences from flooding, making it lower risk. If people live there or there are buildings located in these areas, flooding may have greater consequences, making this higher risk.
The below diagram developed by the Queensland Reconstruction Authority further explains the difference between risk and hazard. The flood hazard depicted is the same in each example.

Source: Queensland Reconstruction Authority 2012, Planning for Stronger, More Resilient Floodplains, p. 10.
How is risk calculated?
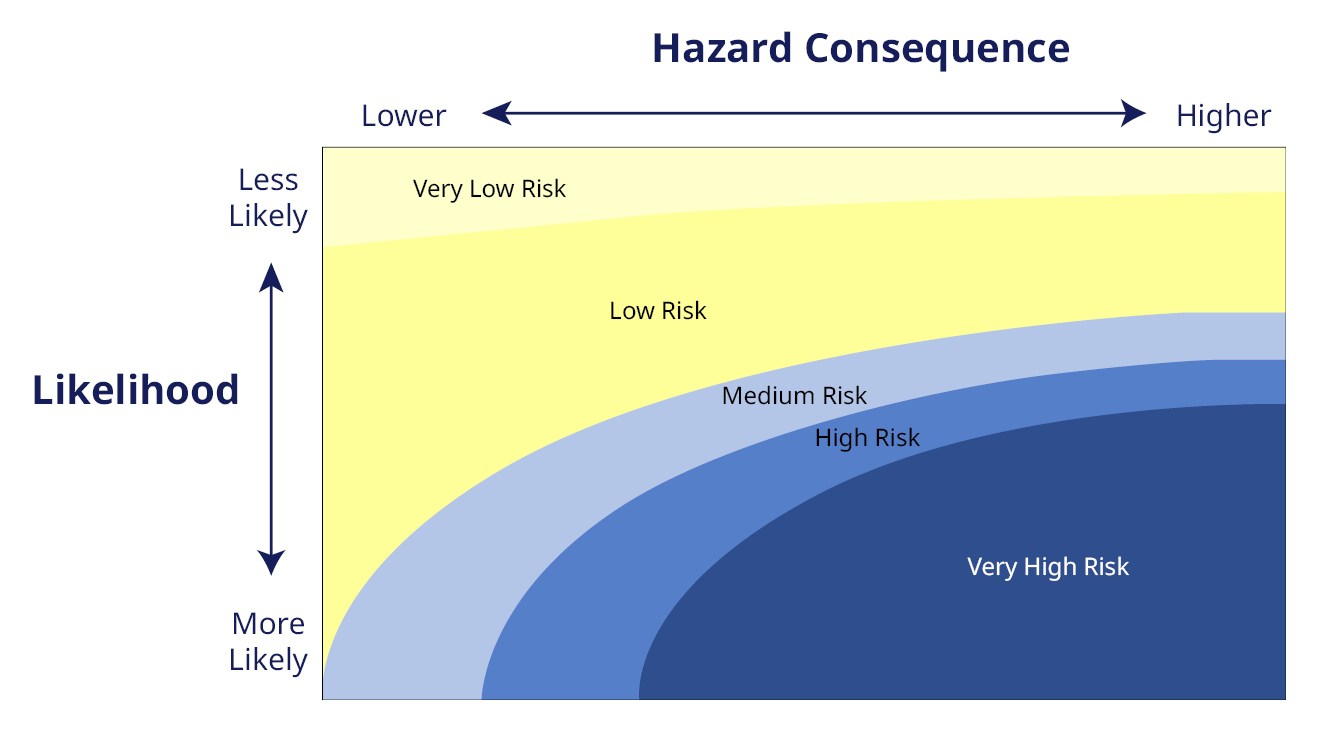
Risk in relation to flooding is a combination of how likely an event is to occur and the consequences of that event. Put simply likelihood multiplied by consequence equals risk.

A flood event that has both a high likelihood of occurring and a high consequence would be considered a very high risk. In contrast, an event that is very unlikely might be considered a lower risk, even if the consequences are higher or, an event that is highly likely to occur but has lower consequence could still be a moderate to high risk.

Likelihood
Likelihood is how likely an event is to occur. For example, for a 1% AEP flood there is a 1% chance of a flood of that severity of greater occurring any year. The flood models estimate the likely extent, depth and velocity of flood waters for a variety of different likelihood events.
Consequence
Consequence is a combination of exposure and vulnerability to these flooding events. However, tolerability can reduce the consequence of these events.
Exposure
Exposure is to do with the scale of impacts. This includes things like how deep of fast flood water will get, and how many people of buildings might be located in these areas. Higher exposure increases consequence, which increases risk.
Vulnerability
Vulnerability is about things that might worsen the impacts of exposure, for example, if areas become isolated during flood events, the people living in those areas are more vulnerable to those events. Higher vulnerability increases consequence, which increases risk.
Tolerability
Tolerability is the opposite of vulnerability and is things that might lessen the impacts of exposure. When communities are well aware of their plans for what do in flood events, this increases the level of tolerability to those events. Higher tolerability reduces consequence, which lowers risk.

Some examples of what is used to measure exposure, vulnerability and tolerability are shown below:

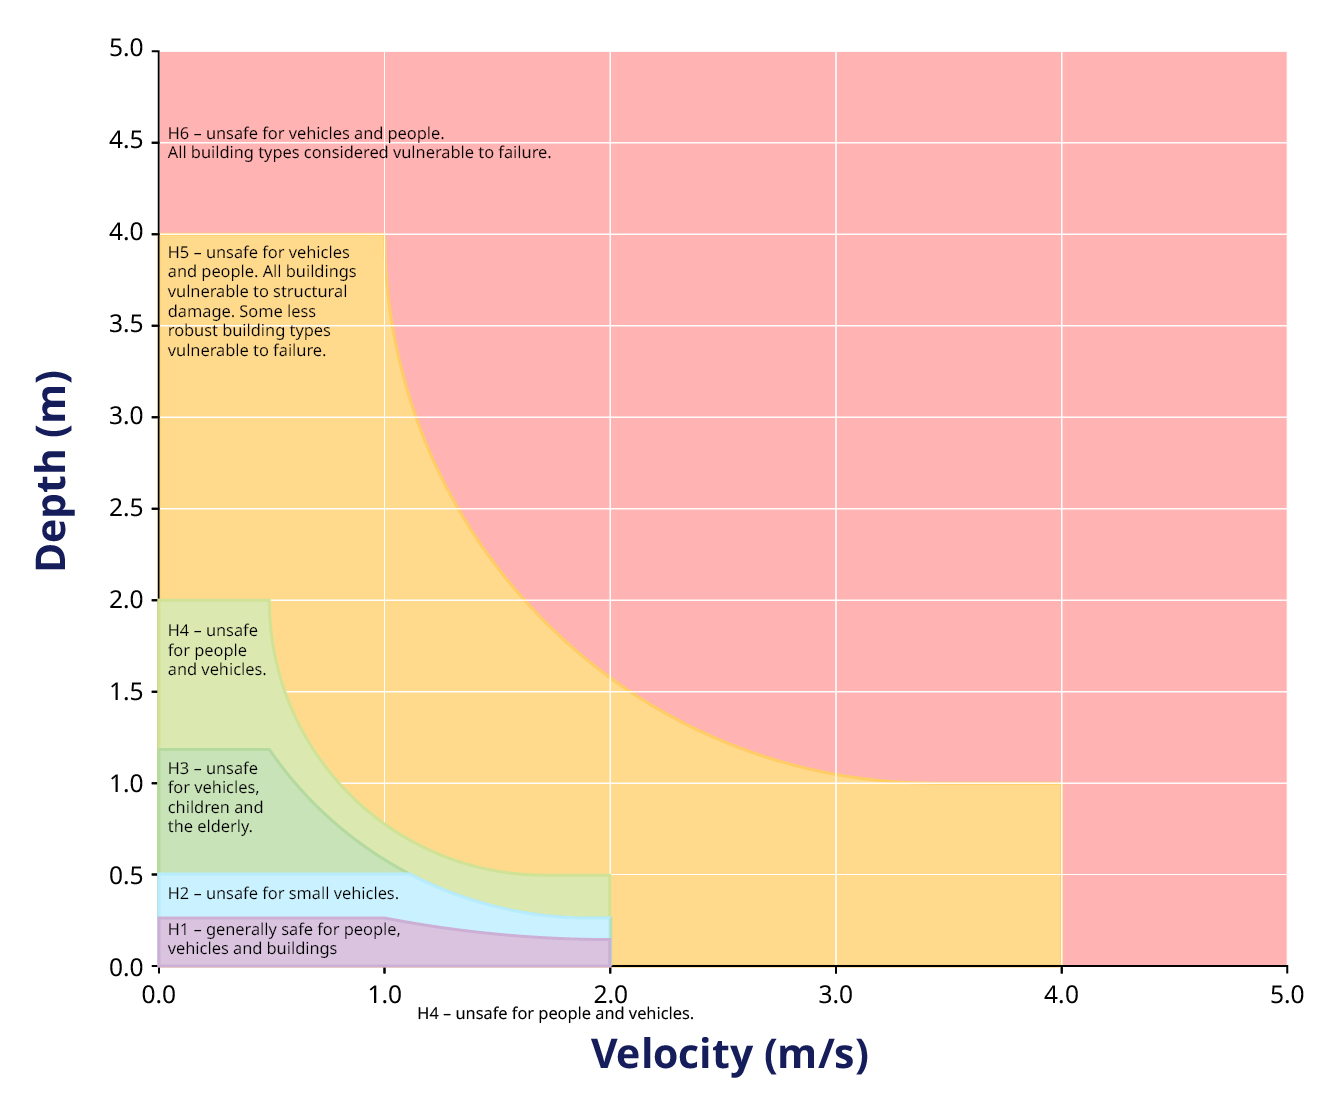
Hazard severity is calculated using the flood models. For flood, this takes into account both the depth and velocity of the water to determine what kinds of impacts these could have on structures, vehicles or people.

Source: General Flood Hazard Vulnerability Curves, AIDR 2017.
To measure other factors of exposure as well as vulnerability and tolerability, the risk assessment incorporated information from the Townsville City Plan, Council’s spatial data, and other agencies such as the Bureau of Meteorology and Australian Bureau of Statistics.
Flood and the Coastal Environment
In coastal areas, flooding can be impacted by coastal inundation. For example, if a tropical cyclone passes close to Townsville, it could bring heavy rainfall to the city. If the same tropical cyclone also produces a storm tide, this might exacerbate flooding in some areas. For this reason, the flood risk assessment needs to consider the impacts of storm tide.
How are the risk assessments being used?
Better Planning
By understanding the risk to people, property and the environment, we can make better planning decisions to improve the resilience of our community. The floodplain risk assessment has also created new flood hydraulic risk mapping, which gives us a more detailed understanding about the different impacts of flood in different areas.
Based on the modelling and the floodplain risk assessment, Council has also developed proposed ways to respond to flood risk in the Townsville City Plan.


