Flood Mapping
Understanding flooding in Townsville
To be resilient to flood risk in Townsville, we all need accurate, accessible information on the possible extent, impact, and the risk of flooding.
Townsville City Council does extensive work to understand these matters and the results of our research, mapping and modelling are available to everyone.
Using our flood information portal, you can access flood depth mapping and flood risk mapping for Townsville.
Flood depth mapping
Our newest flood depth mapping was compiled and validated in 2024. It’s important to remember that these maps show a model of a certain type of flood event. These are not maps of any ‘actual’ historical flooding event – they show a scientific model of what water depth is likely to be in a 1% AEP flood (sometimes referred to as a 1-in-100-year event). This 1% AEP level is what Townsville City Planners and private building certifiers use as the defined flood level and is the benchmark for most planning and building decisions.
The latest flood depth maps now include the forecast impacts of climate change. This is important because we are planning for development that may still be here in many decades. To make this development more resilient, we have used forecast increased rainfall intensity of climate change for the year 2100. Accounting for climate change is also a Queensland State Government requirement.
Our flood information planning tool enables you to compare the existing Townsville flood depth mapping (which did not include climate change impacts) with the new mapping (including climate change) so that you can understand where flood impacts may have changed.
Flood risk mapping
Our new approach to flood resilience recognises that we should consider more than two types of flood events, and we should also consider different degrees of flood hazard. While most development plans for a 1% AEP, flooding events could be larger or smaller than the 1% AEP. That is why we also need to think about what the consequences of the flood would be under many different size floods. Our new approach considers 11 different size flood events and six different severities of hazard. Taken together, hazard and consequence give us a way of assessing potential flood risk.
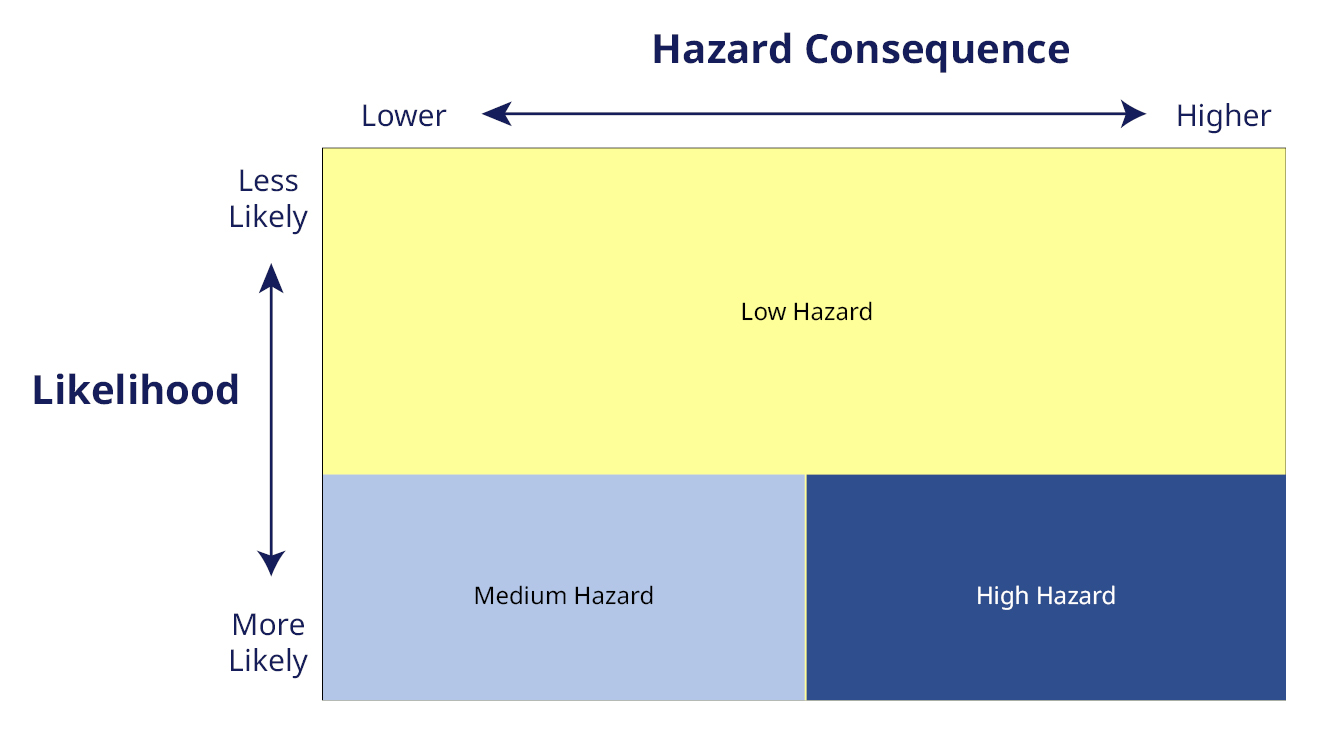
Existing approach to flood hazard mapping.
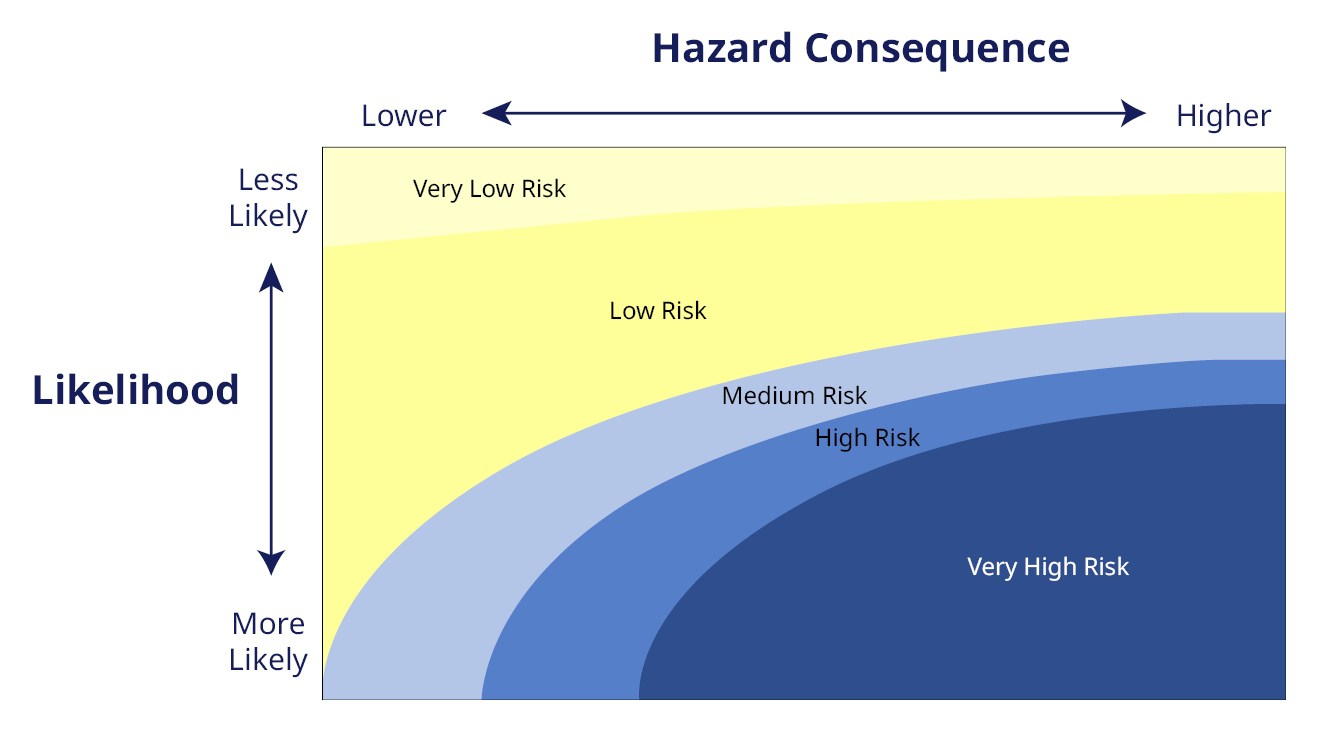
New flood risk mapping approach.
This risk-based model is a much more mature and holistic way of thinking about the impact of flooding. It’s in line with Queensland State Government planning requirements and reflects best practice within planning and the development industry across Australia.
Using this approach (with climate change factors included) we have now created flood risk mapping for all of the flood study areas. In the future, once we have proposed and consulted on all our flood-related amendments, this risk mapping will form the basis of Planning decisions using our amended Townsville City Plan.
Flood risk maps and flood depth maps are tools to help people make decisions about building and other developments, and to help you understand how planning policies can affect any development application made to Townsville City Council.
How were risk mapping categories developed?
When creating flood risk mapping, 11 different likelihoods of flood event – called design events - were considered from more likely events to less likely events. More likely design events occur on average more frequently and tend to have lesser impacts. Less likely design events occur on average less frequently and tend to have greater impacts.
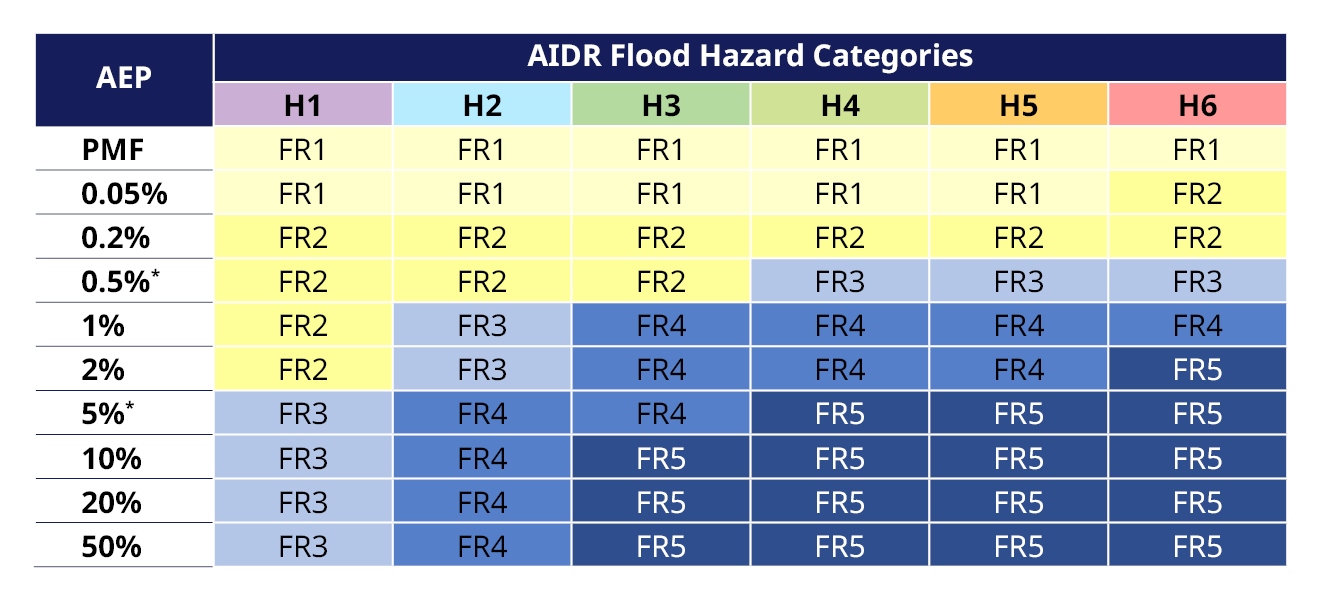
Under each design event, the likely impact was assessed based on the expected depth and velocity of flood waters. These were given a hazard category based on the Australian Institute of Disaster Resilience’s General Flood Hazard Vulnerability Curves which are shown in the table below. Under this table, the lowest hazard (shallowest and slowest water) is given H1, while the highest hazard (deepest and fastest water) is given H6.
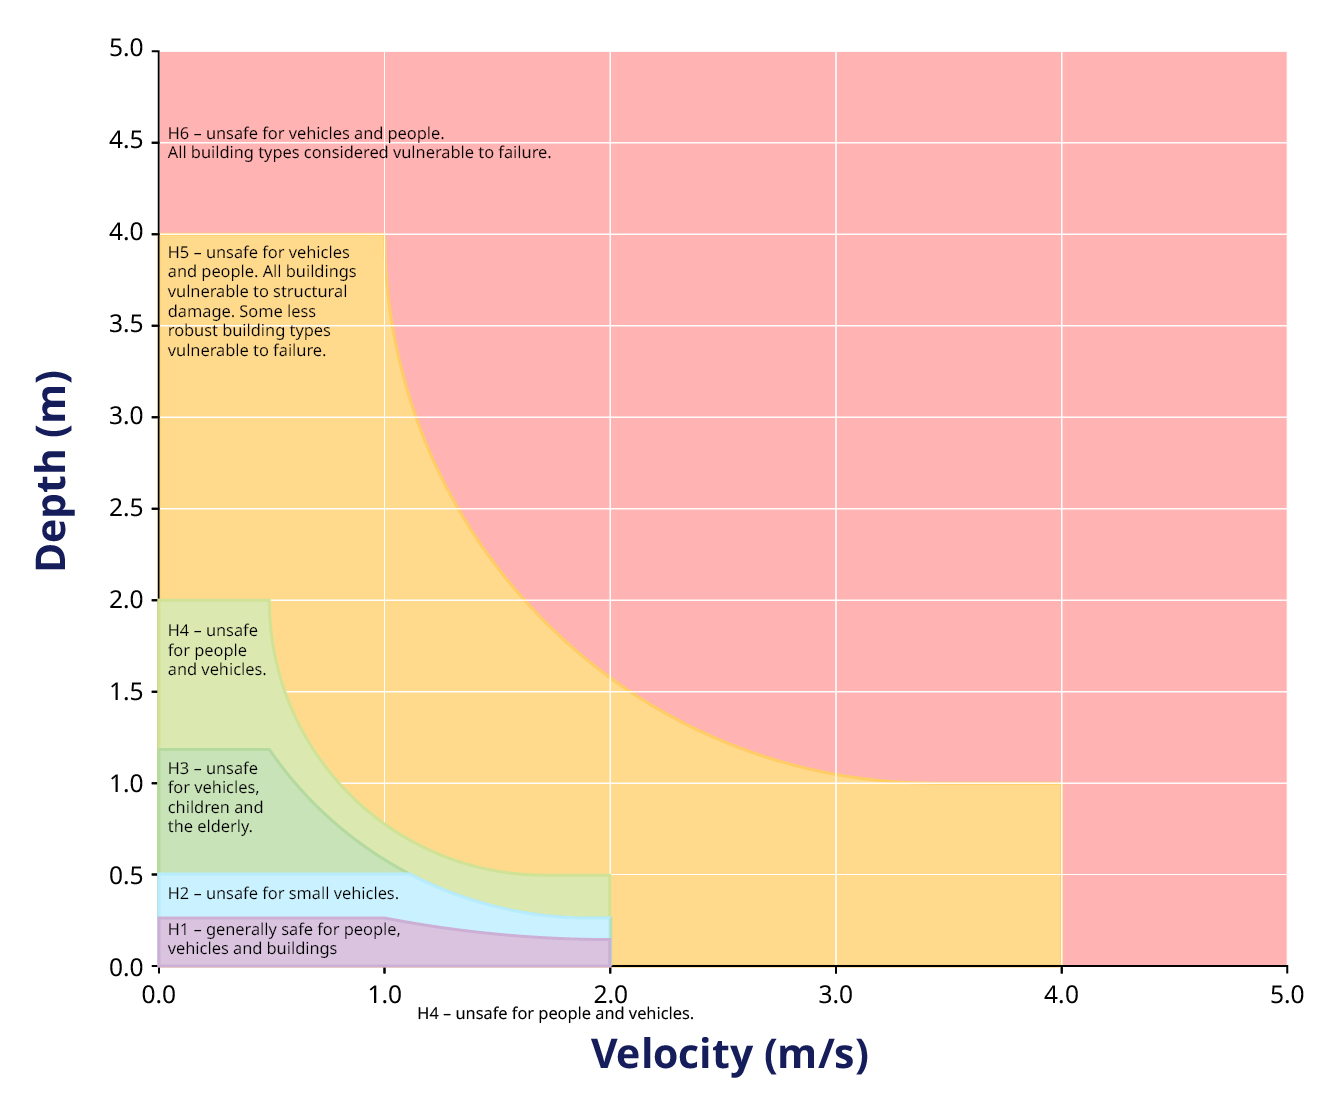
Source: General Flood Hazard Vulnerability Curves, AIDR 2017.
Using the below matrix, each hazard rating under each design event is assigned a different level of risk. Higher hazard ratings increase the risk and so do higher likelihood events. As such, the highest risk areas tend to have both more frequent and higher hazard flooding.
Flood hydraulic risk levels are shown as FR with a number to indicate the level of risk – the higher the risk, the higher the number. The flood hydraulic risk for specific areas were calculated by determining the highest level of risk that location would be exposed to under all design events.
Generally, the FR5 - Very High Risk and FR 4 High Risk areas experience both more severe and more frequent flooding.
FR1 - Very Low Risk and FR2 - Low Risk areas tend to experience more rare and less severe flooding.
FR3 - Medium Risk may be caused by rare flooding which is more severe, frequent flooding which is less severe, or moderate flooding with moderate severity.
Understanding Flood Impacts
Using our flood information planning tool, you can access flood risk maps for Townsville. The tool also enables you to compare the previously used flood hazard maps with our new risk maps. This can help anyone considering building or developing to understand what future Planning decisions might be different in your area under the new risk-based planning approach.
How else do we consider flood risk?
When planning for flood risk, we need to consider other risk factors that might increase or decrease the risk. These other risk factors have been considered in our floodplain risk assessment.

